IDLINES v3
Simon Jeffery, Armagh Observatory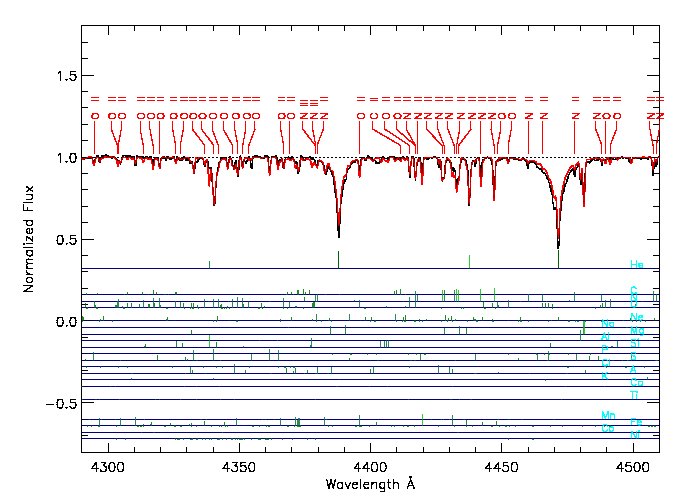
idlines
An IDL procedure to display a region of spectrum, optionally with
a model superimposed on the observations, together with the positions of selected lines.
Positions of lines in common atomic spectra are marked in the lower
panel in logarithmic form. Lines of selected atoms are identified against the observed
spectrum and fit.
Usage
IDL> idlines, specfile, linelist, xlo, xhi, xr, atoms, [thresh, [rv], [Keywords]
Arguments
<specfile> - character string - name of file containing spectrum (and fit) assumed to be x,y file with 3-line header<linelist> - character string - name of file containing eq.widths assumed to be 'spectrum' output
<xlo> - real variable - lower limit of plot
<xhi> - real variable - upper limit of plot
<xr> - real variable - xrange to show in each panel of plot
<atoms> - integer vector - atomic numbers of spectra to be identified
<thresh> - real variable - threshold eq width to identify lines (Angstrom)
<rv> - real variable - radial velocity of spectrum (km/s) (Use this to match line-ids to observed positions).
Keywords
/FIT - overplot the fit/EW - read and select the lines using equivalent widths
/NF - read and select the lines using n*gf (central opacities)
/ALL - plot individual atomic spectra schematically
/MULT - add multiplet labels to line ids
/STIS - to allow for air/vacuum shift at 2000A
/XTEND - extend line identification marks (useful in some cases)
/XPAND - expand plot by factor of 5
/DUPLEX - plot two regions of spectrum on the same panel (overridden by /ALL)
/PRINT - plot hardcopy as a postscript file
Hint: To obtain a nice display
IDL> window,xsize=1024,ysize=600
Input Files
Spectra
sp2: single spectrum (could be observed or model)
sfit: observed spectrum and model fit sfit output file containing observation and solution. Keyword /FIT must be specified
Linelists
lte_lines These linelists contain no information about relative
line strengths, but can be used for inspection of data independent of any models. Many of the linelists in this format contain information about
Moore multiplet numbers, and these can be added to the plot using the keyword /MULT.
The linelist is read in assuming this format by default -- i.e. if neither keyword /NF or /EW is supplied.
/NF: <linelist.used> These linelists are generated by SPECTRUM immediately after a linelist and model atmosphere are read in. This type of
linelist can also be read assuming default options.
However, the final column contains the product of the lower level population * the gf-value at optical depth tau ~ 0.1 -- thus giving an approximate indication of the line strength (neglecting all line-broadening). This can be used to select the lines identified using a parameter thresh (see argument list). To do this, the keyword /NF must be supplied.
/EW: <linelist.eqwid> The function calc_lines in SPECTRUM produces a file containing equivalent widths for all lines in the atomica data input list, with user-specified abundances. The file format is significantly different from the above two formats, so cannot be read unless the keyword /EW is also supplied (at present). The number of lines identified can be changed by adjusting the threshold parameter
Examples
The datafiles required to run each example are provided with the distribution, but can also be downloaded from here.
1. Simple line matching
bd13_rmax.sp2 - spectrum of V652 Her at max radiuslines_woolf.d_USED - list of lines preselected for synthesis, with strengths as produced by SFIT
IDL> print,' Identify all Si,P,S lines in a spectrum '
IDL> idlines, 'bd13_rmax.sp2', 'lines_woolf.d_USED', 4200, 5000, 100, [14,15,16], 0.1, 0
IDL> print,' Identify Si,P,S lines with n*gf > 0.1 in a spectrum (do not plot any fit) '
IDL> idlines, 'bd13_rmax.sp2', 'lines_woolf.d_USED', 4200, 5000, 100, [14,15,16], 0.1, 0, /NF
2. Comparing equivalent widths
bd13_rmax.sp2.fit - spectrum of V652 her at max radius, with model fit as produced by SFITbd13_synth_lines.dat - list of lines and equiv widths for above fit, as produced by SPECTRUM
IDL> print,' Identify C,N,O lines having ew > 10 mA in spectrum with a fit '
IDL> idlines, 'bd13_rmax.sp2.fit', 'bd13_synth_lines.dat', 4200, 5000, 100, [6,7,8], 0.010, /FIT, /EW
IDL> print,' As above with hard copy saved as idlines.ps'
IDL> idlines, 'bd13_rmax.sp2.fit', 'bd13_synth_lines.dat', 4200, 5000, 100, [6,7,8], 0.010, /FIT, /EW, /PRINT
3. Optical spectrum including heavy atoms
PG1219_3951.dat.fit - optical spectrum of PG 1219+534, with model fit produced by SFIT (3900-5100 A)opt_lines.000 - list of lines preselected for synthesis, with equivalent as produced by SFIT
IDL> idlines,'PG1219_3951.dat.fit','opt_lines.000',4000,5000,100,[2,6,7,8,13,14,15,26,28],0.005,-46.6, /FIT, /EW
IDL> idlines,'PG1219_3951.dat.fit','opt_lines.000',4000,5000,100,[2,6,7,8,13,14,15,26,28],0.005,-46.6, /FIT, /EW, /DUP
4. uv spectrum with correction for lambda_vac
PG1219_2224.dat.fit - ultraviolet (STIS) spectrum of PG 1219+534, with model fit produced by SFIT (2200-2400 A)stis_lines.000 - list of lines preselected for synthesis, with equivalent as produced by SFIT
IDL> idlines,'PG1219_2224.dat.fit','stis_lines.000',2200,2400,10,indgen(30),0.001,-58.7, /FIT, /EW, /STIS
Note the use of indgen to generate an integer array for the atomic identifiers. This example will plot all atoms with X≤30
5. Comparing equivalent widths for all ions
bd13_rmax.sp2.fit - spectrum of V652 her at max radius, with model fit as produced by SFITbd13_synth_lines.dat - list of lines and equiv widths for above fit, as produced by SPECTRUM
IDL> print,' Identify C,N,O lines with ew > 10 mA, and mark positions of all lines (see Ex. 2) '
IDL> idlines, 'bd13_rmax.sp2.fit', 'bd13_synth_lines.dat', 4200, 5000, 100, [6,7,8], 0.010, /FIT, /EW, /ALL
6. Identify lines by multiplet
bd13_rmax.sp2.fit - spectrum of V652 her at max radius, with model fit as produced by SFITlines_def.d - multiplets may be identified if the relevant column (9) in the linelist file contains the appropiate identifications (see package lte_lines) (This option can be used in conjunction with others - but the multiplet column must be valid).
IDL> print,' Identify C,N,O lines with multiplet labels where available '
IDL> idlines, 'bd13_rmax.sp2.fit', 'lines_def.d', 4200, 5000, 100, [6,7,8], 0.010, /FIT, /MULT
Example Output
bd13_lines.ps - Plot generated using the above input files and example (5) given above.IDL procedures for plotting spectra and line identifiers
idlines : plot map of spectrum with lines by central intensity
readspec : read spectrum from 2 column x-y file with 3 line header
readspecfit : read spectrum and fit from 4 column file with " " "
plotspec : plot a spectrum onto a new frame
readlist : read linelist in lte-lines format
marklist : marks all lines in linelist
markion : marks positions, identities and wavelengths of given ion
markspec : marks positions and strengths of spectral lines from a given element
markeqwid : marks positions and eq wids of spectral lines from a given element
For additional routines, see also
~/idl/...~/idl/dipsotools.pro